Turn Data Into Your Competitive Advantage
Make smarter decisions with real-time analytics and custom reporting. See what's working, what's not, and where to focus your efforts.
You Can't Improve What You Don't Measure
Most law firms operate on gut instinct and anecdotal evidence. Data-driven firms outperform by identifying opportunities faster, optimizing marketing spend, and holding their team accountable to measurable goals.
Custom Dashboards
Build personalized dashboards that show the metrics that matter most to your role. Partners see firm-wide performance, practice group leaders track their team, and intake coordinators monitor conversion rates.
- Drag-and-drop dashboard builder
- Role-based dashboard templates
- Real-time data updates
- Widget library for common metrics
- Multi-dashboard support per user
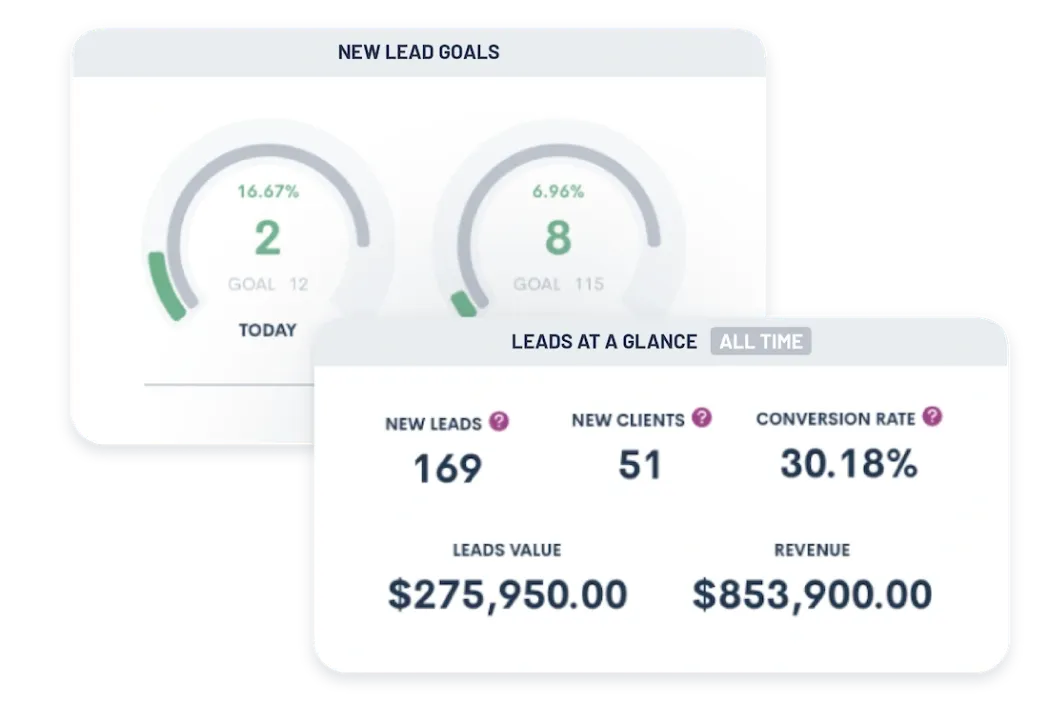
Lead & Marketing Analytics
Understand which marketing channels deliver the best ROI. Track lead volume, conversion rates, and revenue by source to make smarter marketing decisions.
- Lead source attribution and trending
- Conversion funnel analysis
- Cost-per-lead and cost-per-client calculations
- Campaign performance tracking
- Marketing ROI dashboards
Financial Reporting
Monitor your firm's financial health with real-time revenue, collections, and profitability metrics. Identify trends early and make data-driven decisions.
- Revenue forecasting and projections
- Collections and aging reports
- Profitability by matter type and attorney
- Budget vs. actual comparisons
- Cash flow and trust account monitoring
Team Performance Metrics
See how individual attorneys and staff members are performing. Track billable hours, client acquisition, case outcomes, and productivity to recognize top performers and coach those who need support.
- Billable hours and utilization rates
- Client acquisition and retention metrics
- Response time and follow-up compliance
- Task completion and deadline adherence
- Comparative performance rankings
Custom Report Builder
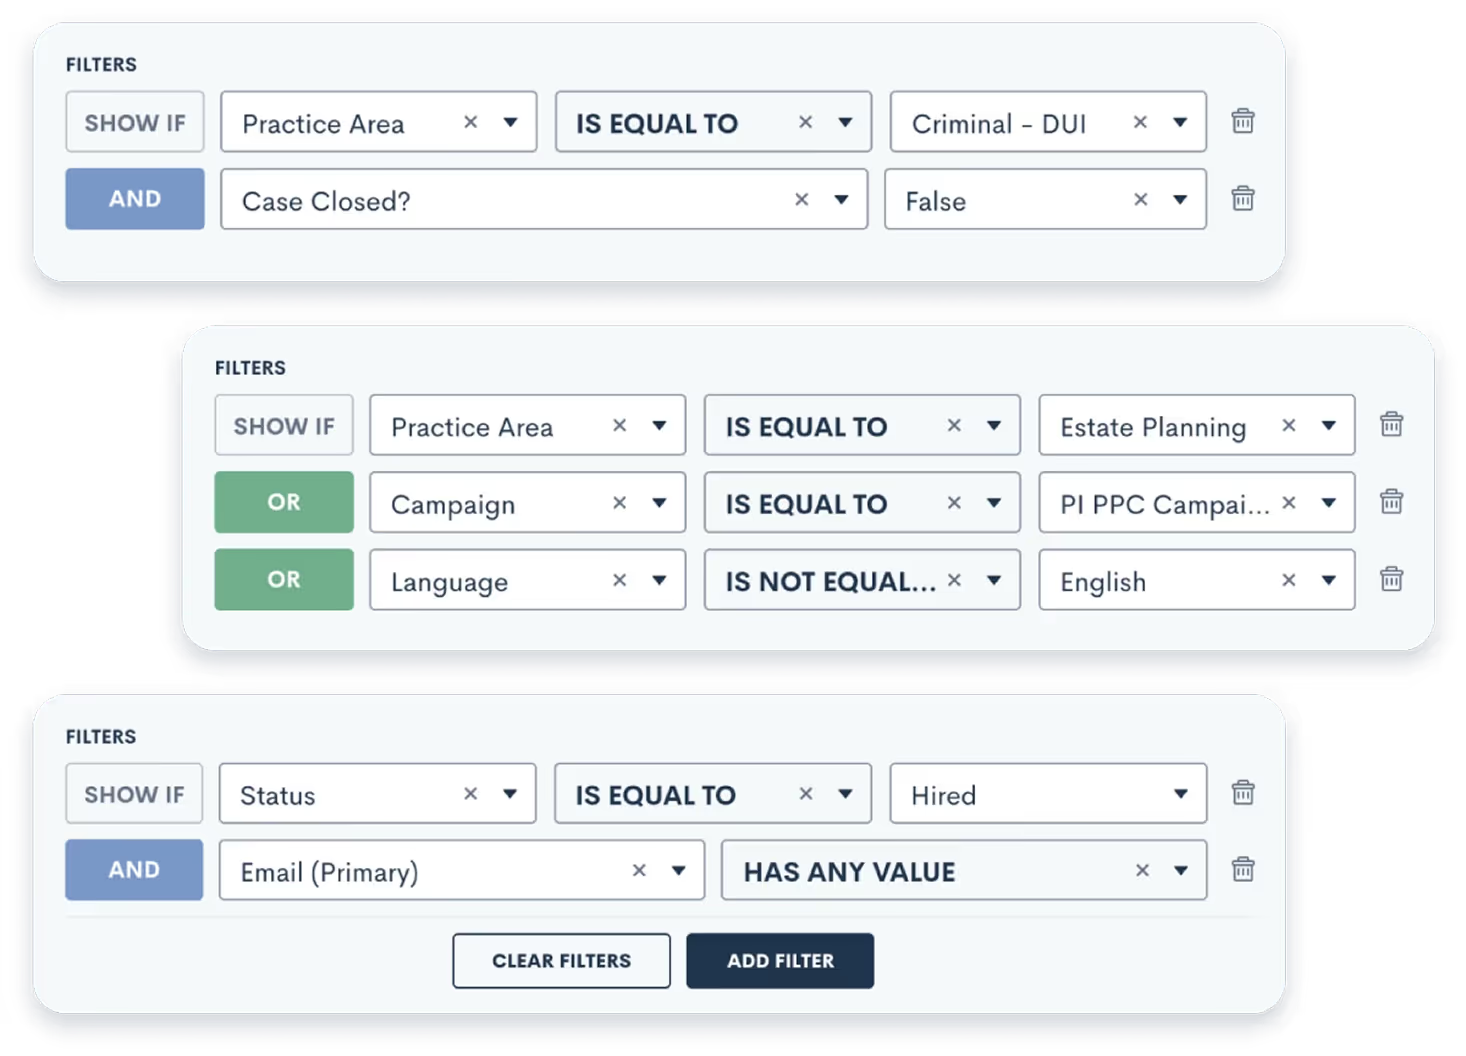
Create exactly the reports you need with our flexible report builder. Filter, group, and visualize data your way, then schedule automatic delivery to stakeholders.
- Visual report builder with SQL-like capabilities
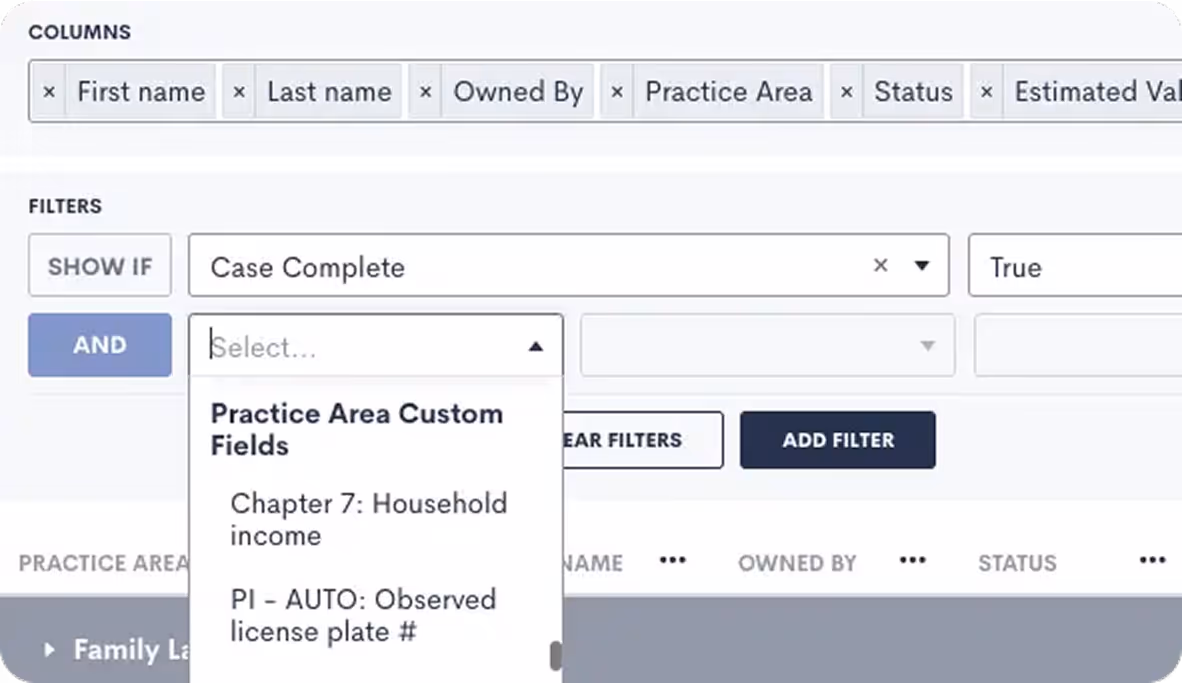
- Filter and group by any data field
- Chart and graph visualization options
- Scheduled report delivery via email
- Export to Excel, PDF, and CSV
Explore Data Reporting Features
Build dashboards, analytics, and KPI tracking that give your firm a clear view of performance.
Custom Reporting
Create reports that match how you run your firm.
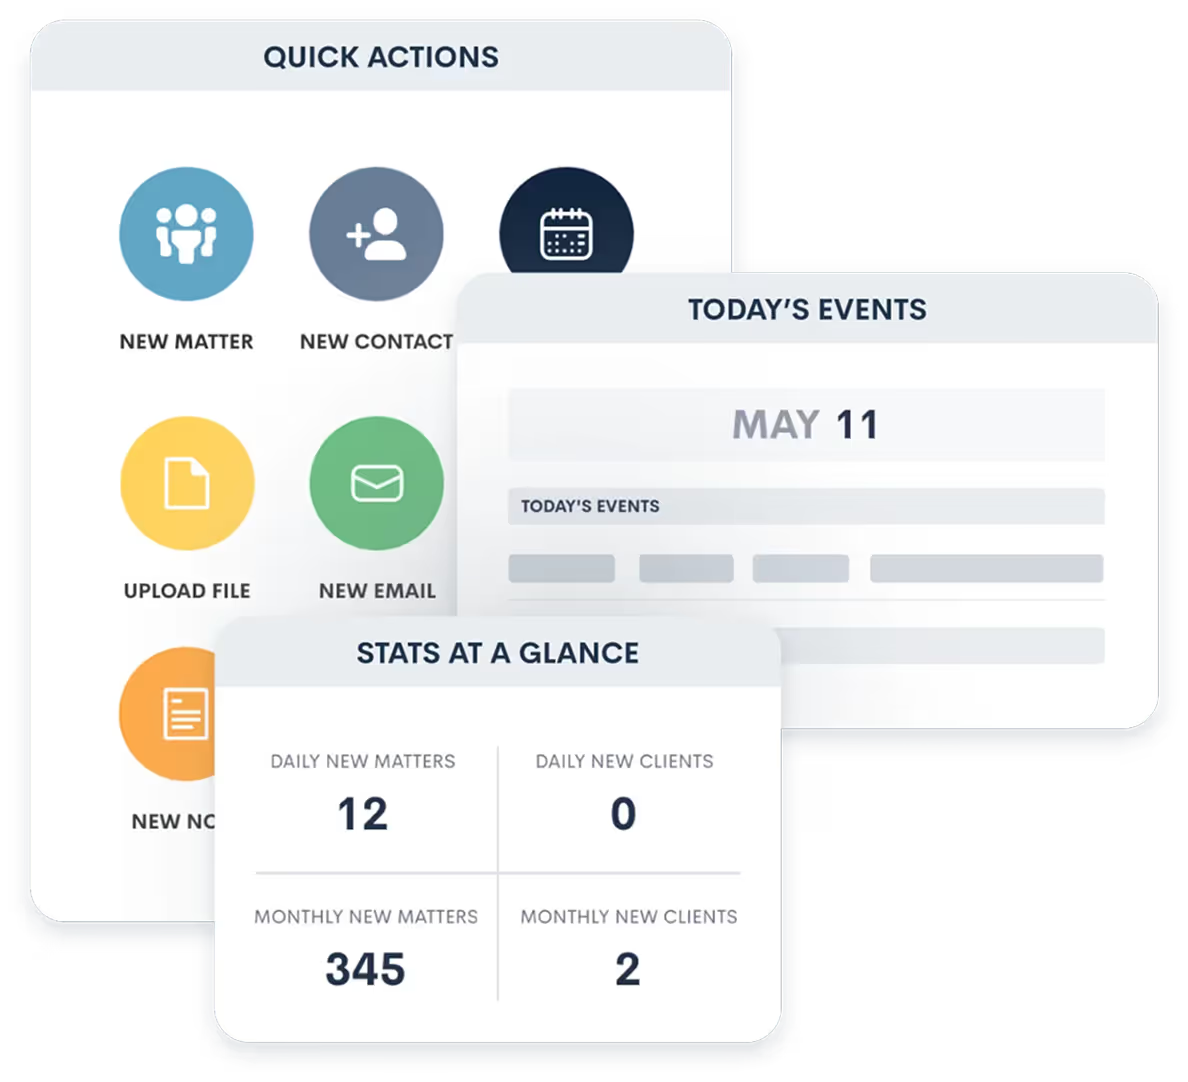
Custom Law Firm Dashboard
One dashboard for the numbers that matter.
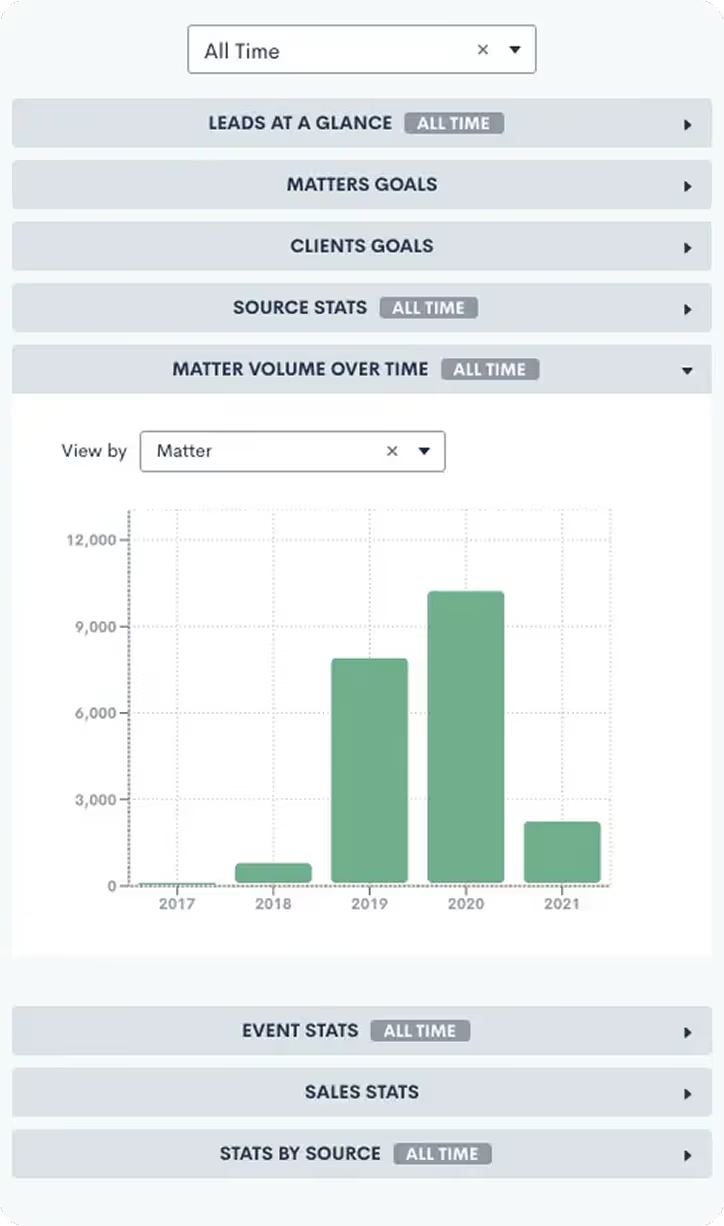
Legal Analytics
Uncover insights across marketing, intake, and matters.
Law Firm KPI Dashboard
Keep KPIs visible and accountable.
Pre-Built Reports to Get You Started
Lead Source ROI
Cost per client by marketing channel
Conversion Funnel
Where prospects drop off in your pipeline
Attorney Performance
Billable hours and client acquisition by attorney
Revenue Forecast
Projected revenue based on pipeline and historical data
Collections Report
Aging receivables and collection rates
Practice Area Analysis
Profitability and volume by case type
Response Time
How quickly your team responds to new leads
Client Retention
Repeat client rates and referral patterns
Marketing Attribution
Which touchpoints lead to signed clients
Actionable Insights, Not Just Numbers
Insight: Google Ads leads convert at 45%, while Facebook leads convert at only 18%
Action: Shift 60% of Facebook budget to Google Ads for immediate ROI improvement
Insight: Leads who receive a response within 5 minutes are 3x more likely to become clients
Action: Implement auto-responders and lead routing to reduce response time
Insight: Estate planning prospects who attend a webinar convert at 2x the rate of other leads
Action: Increase webinar frequency and promote to all estate planning prospects
Insight: Associate attorney A has a 55% conversion rate vs. 35% firm average
Action: Study their intake process and share best practices with the team
Frequently Asked Questions
What metrics can I track?
You can track virtually any metric related to your leads, clients, matters, revenue, and team performance. Common examples include: lead-to-client conversion rate, average case value, marketing ROI by channel, attorney utilization rates, collections percentage, intake response time, client satisfaction scores, and much more.
Can non-technical users create custom reports?
Yes. Our report builder is designed for attorneys and staff, not data analysts. You can create custom reports using a visual interface that doesn't require SQL knowledge or technical expertise. We also provide report templates for common scenarios that you can customize to your needs.
How often does data update?
Most dashboards update in real-time as data changes in the system. Some complex reports may have a short delay (5-15 minutes) to optimize performance. You can also manually refresh any report to see the latest data instantly.
Can I share reports with other people in my firm?
Absolutely. You can share dashboards and reports with specific users, teams, or roles. Set permissions to control who can view vs. edit reports. You can also schedule automatic email delivery of reports on a daily, weekly, or monthly basis.
Does this replace my practice management reporting?
It depends on your needs. Our reporting focuses on business development, marketing, and client acquisition metrics. For case management and legal matter reporting, you'll likely still use your practice management software. However, we integrate with most platforms so you can pull some matter data into our reports for a complete picture.
See Your Firm's Data Like Never Before
Discover insights that can transform your practice with powerful analytics and reporting.
Trusted by leading law firms nationwide